Appearance
2.6 — The Ocean in Motion, and El Niño
Peruvian fishermen noticed centuries ago that every few years, usually around Christmas, the cold nutrient-rich water off their coast was replaced by warm water, the anchovy vanished, and the fishing failed. They called it El Niño — the boy child — after the timing near Christmas.
It took until the twentieth century for anyone to work out that the same event coincides with drought in Australia and Indonesia, floods in Ecuador and California, a weakened Indian monsoon, and disturbances in fisheries and food prices around the world. A change in the wind over one ocean rearranges the weather of half the planet.
This page builds up to that, starting with why the ocean moves at all.
Surface currents: wind-driven, and bent
The top few hundred metres of the ocean are pushed by the wind. Since the wind belts of Chapter 2.2 are steady and global, so are the currents.
But the water does not simply go where the wind pushes it, because the Coriolis effect acts on water exactly as it acts on air. The surface layer is deflected about 45 degrees to the right of the wind in the northern hemisphere (left in the southern). Each layer below drags the layer under it and is deflected a little further, forming a spiral that dies out with depth — the Ekman spiral. Averaged over the whole wind-driven layer, the net water transport is at right angles to the wind: 90 degrees to the right in the north, 90 degrees to the left in the south. That right-angle rule is the key to everything below.
Put the wind belts and the deflection together and you get the gyres. Trade winds blowing westward in the tropics, westerlies blowing eastward in mid-latitudes, and the right-angle deflection between them, produce great closed loops of circulation in each ocean basin — clockwise in the northern hemisphere, anticlockwise in the southern. There are five major ones: North and South Atlantic, North and South Pacific, and Indian.
The western side of each gyre is different from the eastern side, and this is not a detail. Because the Earth rotates and the Coriolis effect grows with latitude, the circulation is squeezed against the western edge of each basin. So the western boundary currents are narrow, deep and fast — the Gulf Stream, the Kuroshio off Japan, the Agulhas off southern Africa, the Brazil Current. The eastern boundary currents are broad, shallow and slow — the Canary, California, Benguela and Peru currents.
The Gulf Stream carries about 30 million cubic metres of water per second past Florida, more than a hundred times the flow of all the world's rivers combined, at up to 2.5 metres per second.

Correcting a popular claim about the Gulf Stream. It is very often said that Britain and Norway would be as cold as Labrador without the Gulf Stream. The ocean's contribution is real but it is not the main reason, and the honest version is more interesting. Detailed work — notably by Richard Seager and colleagues — shows that most of the temperature difference between western Europe and eastern North America at the same latitude comes from the atmosphere: the prevailing westerlies bring air off a large ocean to Europe and off a cold continent to eastern Canada, and the wave pattern of the jet stream set up by the Rockies pushes cold air south over eastern North America and warm air north over Europe. Ocean heat transport contributes a genuine but smaller share. Saying "the Gulf Stream keeps Europe warm" is roughly a quarter right, and this book prefers to say which quarter.
Upwelling: why a few small patches feed the world
Apply the right-angle rule to a coast and something important happens.
Take the Peruvian coast, running roughly north–south, with the trade winds blowing along it from the south. In the southern hemisphere, water transport is 90 degrees to the left of the wind — which, for a southerly wind along a west-facing coast, is offshore.
Surface water is driven away from the coast, and water rises from below to replace it. That deep water is cold and, crucially, loaded with the nitrogen and phosphorus that sank out of the sunlit zone as dead material (Chapter 1.11).
Bring nutrients into sunlight and you get an explosion of phytoplankton, then zooplankton, then fish, then seabirds, then everything else. The Peru–Humboldt upwelling has at times supplied close to a tenth of the entire world fish catch from a strip of ocean a few hundred kilometres long. The same mechanism operates off Namibia, off California, off Morocco and Mauritania, and seasonally off Somalia and the Indian west coast during the monsoon.
Upwelling regions occupy on the order of one percent of the ocean surface and produce a large share of the world's wild-caught fish. That concentration is why an interruption to upwelling is an economic event, not just an ecological one.
The deep circulation: the thousand-year overturning
Below the wind-driven layer, the ocean moves for a different reason: differences in density, which come from temperature and salinity. Cold water is denser. Salty water is denser. The circulation this drives is called the thermohaline circulation, from the Greek for heat and salt.
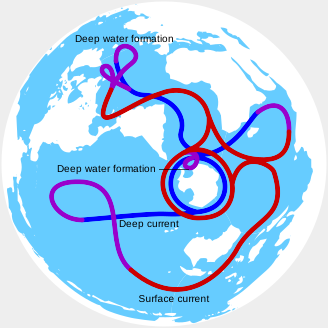
Where the water sinks. There are only two significant regions. In the North Atlantic — the Nordic and Labrador Seas — warm salty water arriving from the tropics loses heat to the cold air, becomes dense, and sinks. Around Antarctica, sea ice formation is the driver: when seawater freezes, the salt is largely excluded from the ice and left behind in the water below, making it extremely salty and dense. That water sinks down the continental slope and fills the deepest parts of every ocean basin.
Why the North Atlantic and not the North Pacific, which is at the same latitude? Because the Atlantic is saltier. It loses more water to evaporation than it gains from rivers and rain, partly because water vapour is carried across the narrow isthmus of Central America into the Pacific by the trade winds. The Pacific is too fresh at the surface to sink, so it has no northern deep-water formation.
The circuit takes about a thousand years. Water sinking off Greenland today will return to the surface, somewhere, in roughly the time since the Chola empire. This is why the deep ocean responds slowly to anything happening at the surface, and it is why the carbon absorbed by the ocean is not going to come back quickly.
Can it stop? This is a serious research question and it deserves a careful answer rather than either dismissal or alarm. The mechanism of concern is real: adding fresh water to the North Atlantic — from melting Greenland ice and increased rainfall — reduces surface salinity and therefore density, which makes sinking harder. There is geological evidence that this has happened before. During the last deglaciation, sudden discharges of meltwater from North America appear to have disrupted the circulation and produced abrupt regional cooling of several degrees within decades, recorded in Greenland ice cores. The most recent, the Younger Dryas about 12,900 years ago, is discussed in Chapter 3.6.
What the current evidence supports: the Atlantic overturning has probably weakened somewhat, direct measurement began only in 2004 so the record is short, and models project further weakening this century. What the evidence does not support: a complete shutdown as a likely near-term outcome, or the scenario in disaster films where Europe freezes in a week. This book states the uncertainty rather than resolving it artificially.
El Niño, in full
Now the mechanism, built from the pieces above.
The normal state, which is itself a wind-driven imbalance. Trade winds blow from east to west across the tropical Pacific. They push warm surface water westward, so it piles up around Indonesia — the sea surface there is about half a metre higher than off Peru, and the warm layer is far deeper. Off South America, the removal of that surface water allows cold water to upwell.
So the western Pacific is warm and wet — rising air, towering convection, heavy rain over Indonesia, Papua New Guinea and northern Australia. The eastern Pacific is cool and dry — sinking air, and the coastal deserts of Peru and northern Chile, which include the Atacama, the driest place on Earth. The loop connecting them, west to east at height and east to west at the surface, is called the Walker circulation, after Gilbert Walker, who was Director-General of Observatories in India in the early twentieth century and who went looking for the cause of monsoon failure. The discovery of this system came out of Indian famine research.
El Niño is what happens when the trade winds slacken. The warm water piled up in the west is no longer held there, so it sloshes back eastward across the Pacific as a slow wave. Upwelling off Peru is cut off, because the warm layer is now too deep for the wind to reach cold water.
And here is the feedback that makes it an event rather than a wobble. Warm water in the central and eastern Pacific means convection and rainfall shift east. That shift weakens the pressure difference across the Pacific, which weakens the trade winds further, which lets more warm water move east. The system reinforces its own change — a positive feedback known as the Bjerknes feedback — which is why El Niño develops over months into a large, coherent state rather than fizzling.
It does not run away forever, because slow ocean waves reflecting off the western boundary eventually return and reverse the conditions, which is why the phenomenon oscillates on a roughly two-to-seven-year cycle. The whole cycle is called the El Niño–Southern Oscillation, and La Niña is the opposite phase: unusually strong trades, unusually cold eastern Pacific, and generally the reverse of El Niño's effects.
What El Niño does around the world. Because it shifts where the largest heat source in the tropics sits, it rearranges the whole tropical circulation and sends waves into the mid-latitudes.
| Region | Typical El Niño effect |
|---|---|
| Peru, Ecuador | Heavy rain, floods; fishery collapse |
| Indonesia, Australia | Drought, fire risk |
| India | Weaker monsoon, on average |
| East Africa | Wetter |
| Southern USA | Wetter; northern USA milder |
| Atlantic hurricanes | Fewer, because shear increases |
| Pacific typhoons | Shift eastward |
| Global mean temperature | Rises by roughly 0.1–0.2 °C for a year |
Two cautions. These are tendencies across many events, not guarantees for any one. And El Niño events differ from each other — some have their warm anomaly in the central Pacific rather than the east, and their effects differ correspondingly.
The 1997–98 event was the strongest of the twentieth century and is estimated to have caused tens of billions of dollars of damage worldwide. It also, as noted in Chapter 2.5, did not produce an Indian drought, because a strong positive Indian Ocean Dipole worked the other way.
It is now forecastable months in advance, which is a genuine achievement. A network of moored buoys across the tropical Pacific, put in place after 1982–83 caught everyone unprepared, measures subsurface temperature continuously, and the eastward-moving warm water in the subsurface gives several months of warning before it surfaces. Peru, Australia and India all now plan around ENSO forecasts — adjusting crop advisories, reservoir management and food procurement.
Where this shows up in your life
Food prices, worldwide. A strong El Niño can hit Australian wheat, Indian rice and pulses, Indonesian palm oil, Southeast Asian rice and West African cocoa in the same year. Global soft-commodity prices respond, and so does Indian food inflation.
Fisheries. The Peruvian anchoveta catch is the world's largest single-species fishery and is used mostly as fishmeal for aquaculture and livestock. A collapse there raises the cost of farmed fish and animal feed on the other side of the world, which is as clear an example of physical connectedness as economics offers.
Coral bleaching. Warm water causes corals to expel the symbiotic algae that feed them and colour them. The major global bleaching events of 1998, 2010 and 2015–16 all coincided with strong El Niños superimposed on a warming baseline.
And a piece of history. The great famines of 1876–78, which killed millions in India, China and Brazil simultaneously, coincided with one of the strongest El Niños on record. The physical trigger was global; the death tolls were local and were decided by policy. Chapter 6.17 examines the Indian half of that in detail, and it is one of the sharpest illustrations in this volume of why a book about the world needs both the physics and the politics on the same page.
What the next page covers
We now have the atmosphere, the ocean and the machinery connecting them. Run that machinery over a spinning tilted planet with continents in particular places, and the result is a patterned world — belts of rainforest, desert, grassland and tundra that repeat on every continent. Chapter 2.7 covers climate zones and biomes: the classification system that actually works, why each biome sits where it does, what kind of life each supports, and how the map of climate has quietly determined where the world's people, crops and cities ended up.