Appearance
2.8 — Ice Ages and the Rhythms of Climate
Twenty-one thousand years ago, an ice sheet three kilometres thick sat on the site of Montreal, Stockholm and Manchester. Sea level was about 120 metres lower than today. You could walk from Siberia to Alaska, from mainland Southeast Asia to Java, and from France to England. The Sahara was larger and the Amazon smaller. India's coastline lay well out beyond where it is now, and the Gulf of Khambhat and the Palk Strait were dry land.
Then, over roughly ten thousand years, it all melted. And within a few thousand years of the melt finishing, people in at least eleven separate parts of the world independently began planting crops.
That sequence is not a coincidence, and this page is about why.
What an ice age actually is
Technically we are in one now. An ice age is a long period during which permanent ice sheets exist somewhere on Earth, and Greenland and Antarctica qualify. The current one — the Quaternary glaciation — began about 2.6 million years ago.
Within an ice age, the climate swings between:
- Glacial periods — colder, ice sheets advance, sea level drops. These last roughly 80,000 to 100,000 years.
- Interglacial periods — warmer, ice sheets retreat to the poles, sea level rises. These last roughly 10,000 to 30,000 years.
We are in an interglacial, called the Holocene, which began about 11,700 years ago. In popular speech "the Ice Age" means the last glacial period, which peaked about 21,000 years ago — the Last Glacial Maximum.

And it is worth stating that ice ages are unusual in Earth's history. For most of the past 500 million years there was no permanent polar ice at all — dinosaurs lived at high latitudes in a world where Antarctica had forests. There were, however, earlier ice ages, including the extraordinary Snowball Earth episodes around 700 million years ago when the evidence suggests ice reached the tropics.
The orbital cause: Milankovitch cycles
The Earth's orbit is not a fixed circle, and the axis is not fixed either. Three separate variations, on three different timescales, change how sunlight is distributed over the planet.
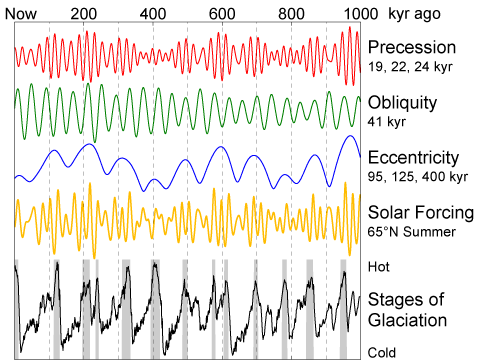
Eccentricity — about 100,000 years. The orbit's shape stretches from nearly circular to slightly elliptical, pulled by Jupiter and Saturn. This changes the total annual sunlight only slightly, but it changes how much difference there is between the closest and farthest points of the orbit.
Obliquity — about 41,000 years. The tilt of the axis varies between roughly 22.1 and 24.5 degrees. It is currently 23.4 and slowly decreasing. More tilt means stronger seasons in both hemispheres; less tilt means milder seasons and cooler summers at high latitudes.
Precession — about 19,000 to 23,000 years. The axis wobbles like a slowing top, so the direction it points traces a circle. This changes which season occurs when the Earth is closest to the Sun. Currently the northern hemisphere has winter at closest approach, which makes northern seasons slightly milder; 11,000 years ago it was the reverse.
Milutin Milanković, a Serbian engineer, computed all of this by hand in the 1920s and 30s, much of it while interned during the First World War, and produced curves of summer sunlight at each latitude going back hundreds of thousands of years.
His crucial insight was about which season matters. Ice sheets grow when snow survives the summer. So the controlling variable is not how cold the winter is — it is how cool the summer is at high northern latitudes, around 65 degrees north, where the land is that ice sheets can grow on. A mild winter with heavy snow followed by a cool summer builds ice. A brutal winter followed by a warm summer does not.
The northern hemisphere controls the cycle because that is where the land is. The southern hemisphere at the same latitudes is nearly all ocean, which cannot hold an ice sheet.
The confirmation came in 1976. A study of deep-sea sediment cores by James Hays, John Imbrie and Nicholas Shackleton extracted the oxygen isotope record (Chapter 1.1) and ran a frequency analysis on it. The peaks came out at approximately 100,000, 41,000 and 23,000 years — exactly Milanković's periods, from data that had nothing to do with astronomy. The paper's title was "Variations in the Earth's Orbit: Pacemaker of the Ice Ages", and the theory has been mainstream ever since.
Why the orbital nudge is far too small on its own
Here is the honest problem with the theory, and the answer is where the real physics is.
The change in sunlight from orbital variation is small — a few percent of summer insolation at high latitudes, and almost nothing in the global annual total. The observed temperature swing between glacial and interglacial is 4 to 6 °C globally and much more at the poles. The orbit cannot do that by itself. Something amplifies it, and the amplifiers are what actually make an ice age.
Amplifier one: ice reflects sunlight. Fresh snow reflects 80 to 90 percent of the light hitting it; ocean and forest absorb most of theirs. So a little extra ice means less absorbed sunlight, which means cooling, which means more ice. This ice–albedo feedback is powerful and it works in both directions, which is why deglaciations are fast once they start.
Amplifier two: carbon dioxide, and this is the big one. Ice cores show that atmospheric carbon dioxide was about 180 parts per million during glacial maxima and about 280 during interglacials — a 35 percent swing, moving in lockstep with temperature over eight complete cycles.
Where the carbon goes during a glacial is still not fully settled, which this book states rather than glossing. The leading contributors: colder water dissolves more carbon dioxide; changes in Southern Ocean circulation and sea-ice cover reduce the return of deep carbon-rich water to the surface; and increased dust delivers iron to the ocean, fertilising plankton growth that pulls carbon down.
Amplifier three: dust and vegetation. Glacial worlds are dry and windy, so there is far more atmospheric dust, and forests contract while deserts and grasslands expand — each of which changes reflectivity and the carbon cycle further.
Put together, the account is: the orbit sets the timing, and the feedbacks supply the size. This is a general shape worth carrying forward — a small forcing can produce a large climate change if the system contains strong feedbacks, and the Earth's does.
Reading the record: ice cores

Chapter 1.1 introduced the method. What makes ice cores exceptional is that they give two independent measurements from the same sample: the isotopes of the ice itself record temperature, and the air bubbles trapped in it are literal samples of the ancient atmosphere.
The temperature signal. Water containing the lighter oxygen-18 and hydrogen isotopes evaporates and condenses at slightly different rates than heavy water, and the fractionation depends on temperature. So the isotope ratio of the ice tells you how cold it was when that snow fell.
The gas signal. Bubbles sealed as the snow compacts hold the actual air of that year. This is not a proxy or a model — it is the sample.
The Vostok core reaches back 420,000 years; the EPICA Dome C core reaches about 800,000. Ongoing projects are targeting 1.5 million years, to look at why the dominant cycle changed.
The lead-and-lag question, handled honestly, because it is frequently misrepresented. In the ice-core record, at the start of a deglaciation, Antarctic temperature rises a few hundred years before carbon dioxide does. This is sometimes presented as proof that carbon dioxide does not cause warming. The proper reading is this: the initial trigger is orbital, not carbon dioxide, so of course carbon dioxide does not lead; the warming then releases carbon dioxide from the ocean, which then amplifies the warming, which releases more. The great majority of the total warming happens after the carbon dioxide rise, not before it. Cause and amplifier are different roles, and the record shows carbon dioxide in the second role during glacial cycles. It does not follow that it cannot be in the first role when something else — an eruption, or an industry — puts it there directly.
The mysteries that remain
The 100,000-year problem. For the first million years of the Quaternary, cycles ran on the 41,000-year obliquity beat. About a million years ago they switched to roughly 100,000 years. But eccentricity, the 100,000-year cycle, is by far the weakest of the three in its effect on sunlight. Why the climate system responds most strongly to the weakest forcing, and why it changed its mind a million years ago, is not settled. Explanations involve the gradual removal of thick soil layers from under the northern ice sheets, and long-term decline in carbon dioxide.
Abrupt events. The last glacial period was not steadily cold. Greenland ice cores show Dansgaard–Oeschger events — around twenty-five occasions when Greenland temperature jumped by 8 to 15 °C within decades, then cooled slowly over centuries. The likely mechanism involves the ocean overturning circulation of Chapter 2.6 switching between states. The lesson is that climate can change extremely fast when it crosses a threshold, and this is one of the strongest reasons to be cautious about pushing the system.
The Younger Dryas. About 12,900 years ago, as the world was warming out of the last glacial, the northern hemisphere abruptly returned to near-glacial cold for about 1,200 years — and then ended it within perhaps a few decades. The leading explanation is a massive freshwater discharge from a proglacial lake into the North Atlantic, shutting down the overturning circulation. An impact hypothesis has also been argued and is not accepted by most specialists. Chapter 3.7 shows why the Younger Dryas matters for the origin of agriculture.
The Holocene: eleven thousand unusually quiet years
The interglacial we live in has been remarkably stable, and that stability is not typical of the record. Global average temperature over the last 11,700 years has varied within roughly a degree, with no Dansgaard–Oeschger swings.
Every civilisation in this volume exists inside that window. Farming, cities, writing, empires, industry — all of it in a single unusually calm interglacial. It is difficult to see how any of it could have developed during the last glacial: too cold, too dry, too much atmospheric dust, carbon dioxide too low for good plant growth, and above all too unstable. A society cannot plant a crop in a place where the climate reorganises within a human lifetime. Chapter 3.7 makes this argument in full.
Within the Holocene there have been real but small fluctuations, and they show up in history.
- The Holocene Climatic Optimum, roughly 9,000 to 5,000 years ago, slightly warmer in the northern summer — this is the green Sahara period of Chapter 2.7.
- The 4.2-kiloyear event, around 2200 BCE, a widespread drought implicated in the end of Egypt's Old Kingdom and the Akkadian empire, and argued as a factor in the Indus decline. Argued, not established — the correlation is real, the causal weight is disputed, and Chapter 4.3 says so.
- The Medieval Warm Period, roughly 950 to 1250 CE, warm in the North Atlantic region — this is when Norse settlers farmed in Greenland. It was regional, not global, which is why it is a poor argument about present warming in either direction.
- The Little Ice Age, roughly 1300 to 1850, cooler in Europe and elsewhere, with contributions from reduced solar activity and several large volcanic eruptions. The Thames froze hard enough for fairs on it, alpine glaciers advanced over villages, and Chapter 7.7 and Chapter 8.7 both refer to the harvest failures it produced.
Where this shows up in your life
Your country's coastline is a temporary arrangement. Sea level has risen about 120 metres in the last 20,000 years, most of it between 15,000 and 7,000 years ago at rates that at times exceeded a metre per century. Submerged settlements exist off the coasts of Israel, Britain, India and elsewhere, and the Doggerland region of the North Sea, now under water, was inhabited land where trawlers still pull up worked flint and bones.
Land is still rising where the ice was. Removing a three-kilometre ice sheet unloads the crust, and the mantle beneath flows back slowly (Chapter 1.3). Scandinavia and Canada are still rising by up to a centimetre a year, thousands of years after the ice went. This is why some Swedish medieval harbours are now inland, and why sea level rise measured at a tide gauge has to be corrected for what the land itself is doing.
Your soil, if you live in the northern temperate zone, was delivered by ice (Chapter 1.9).
And the next glacial. On orbital grounds alone, the current interglacial would be expected to end within the next several thousand to tens of thousands of years — the exact timing depends on which model and on the fact that the present orbital configuration resembles an unusually long interglacial of about 400,000 years ago. Modelling work suggests that the carbon dioxide already added is sufficient to delay the next glaciation substantially. That is not a defence of emissions; it is a statement about how large the intervention has been relative to a natural cycle.
What the next page covers
We can now describe the climate system: an atmosphere, an ocean, circulation patterns, storms, monsoons and orbital rhythms. The final question of this Part is practical. Chapter 2.9 explains how a weather forecast is made — how the equations are turned into a computable grid, why forecasts are good for a week and useless beyond two, what "70 percent chance of rain" actually means, how the whole global observing system works, and why the improvement in forecasting over the last forty years is one of the least celebrated scientific achievements of the age.